A November to Remember - Scaling A Personalized Brand's Revenue by 306% in just 30 days.
This is a case study of a US based Independent personalized products brand. The brand sells customized blankets, rugs, wall prints etc.
We started media planning for the brand in October 2023 and kick-started the project and ecommerce activity in the first week of October itself,.
About the
Brand
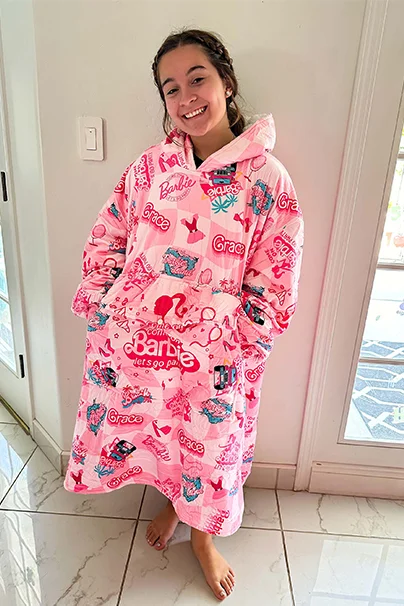
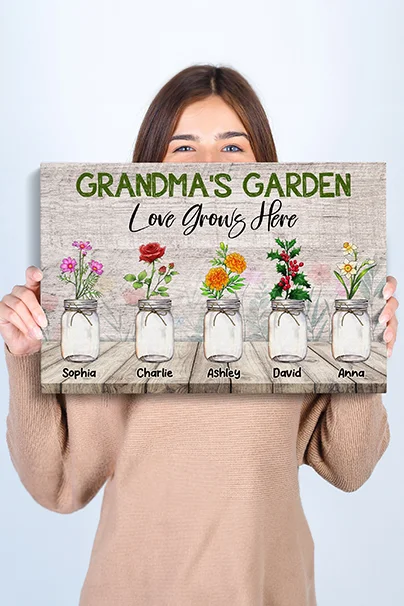
Amor Custom Gifts is a Texas-based company offering personalized gifts and home decor made in the USA and around the world.
Challenges
No proper paid media strategy that would include Facebook Ads, Google Ads, Email & Social Media.
Unable to make performance-driven creatives at bulk, because the business was running solely by the owner, it was very hard for her.
Objectives
Scale the revenue with a healthy ROI of 2.5-
3X
Set up a multichannel marketing to increase the first time buyers as well as repeat customers.
Solutions Recommended
A proper strategic multi channel ad funnel
Start full fledged Facebook ads with performance-driven creatives
Scaling while maintaining a profitable ROI of 2.5-3x
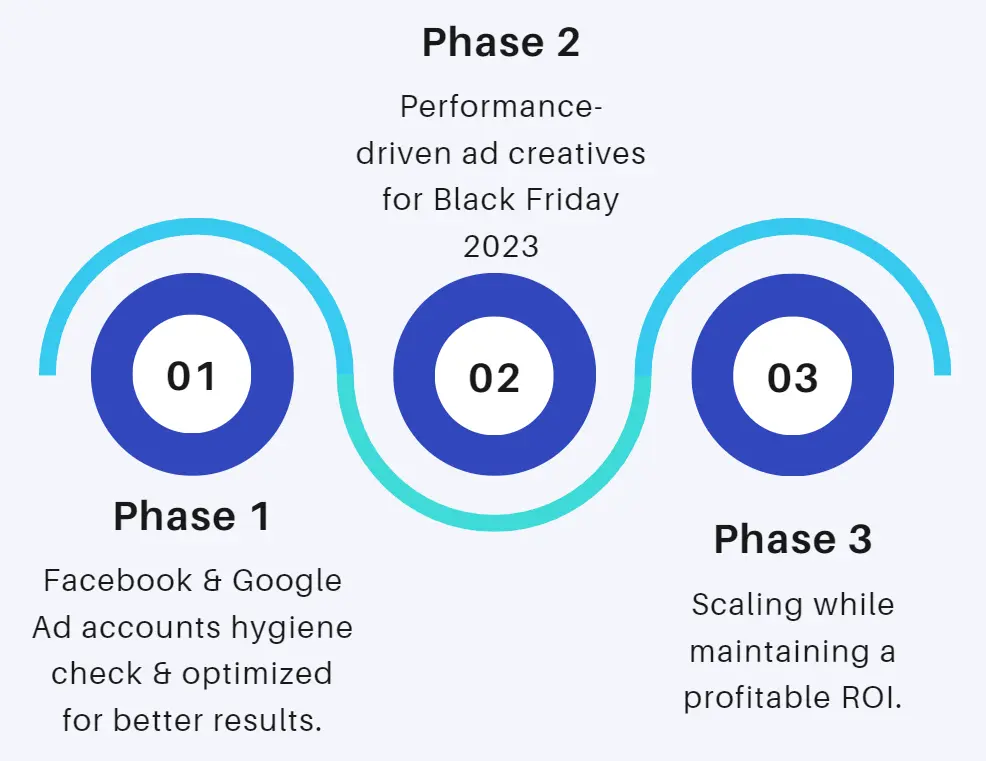
Implementation
Phase I
Ad Account Optimisation
First we did a hygiene check of their Facebook & Google ad account. Made some changes in the targeting & budget for better conversions.
Analyzed the past best-performing ads & relaunched them with better copy & new audience.
Phase 2
Black Friday 2023
The time when we started ads, other brands already started running BFCM creatives. We knew that event could played a huge part for their future success. So, we quickly jump onto that, made performance-driven creatives bulk & started launching them.
We analyzed DPAs and UGC videos were their best-performing creative types, so we made sure to keep few DPA Frames and videos ready.
Phase 3
Scaling profitably
A lot of adsets were having very good performance but the budgets were so low. So we increased the budget on winning ones & cut down the non-performing ones.
The brand had so much potential, from a daily budget of $150 per day to $350 a day in a span of 1 month.
Impact
Generated $43k revenue in 2 months
ROI: 3X
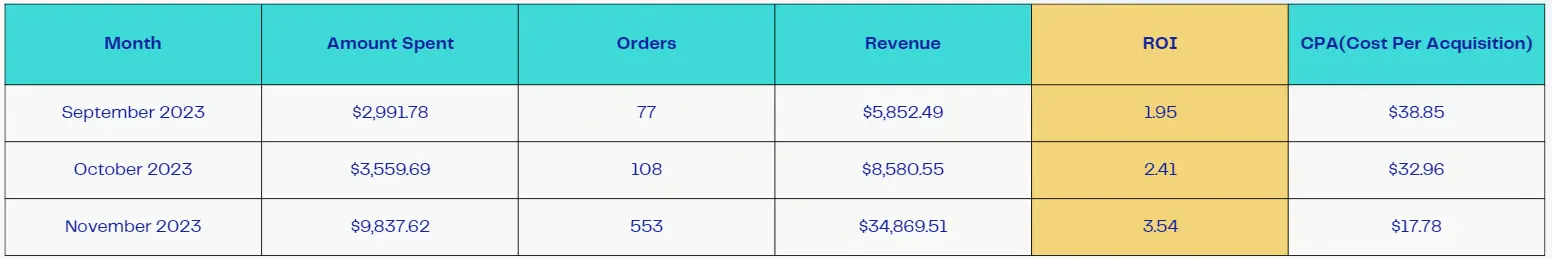
Month on Month
Performance Overview
Metrics
October 2023 - September 2023
Spent
116%
$13,032.07
Revenue
242%
$43,450.06
ROI
59%
3.33
Blended CAC
41.85%
41.85%
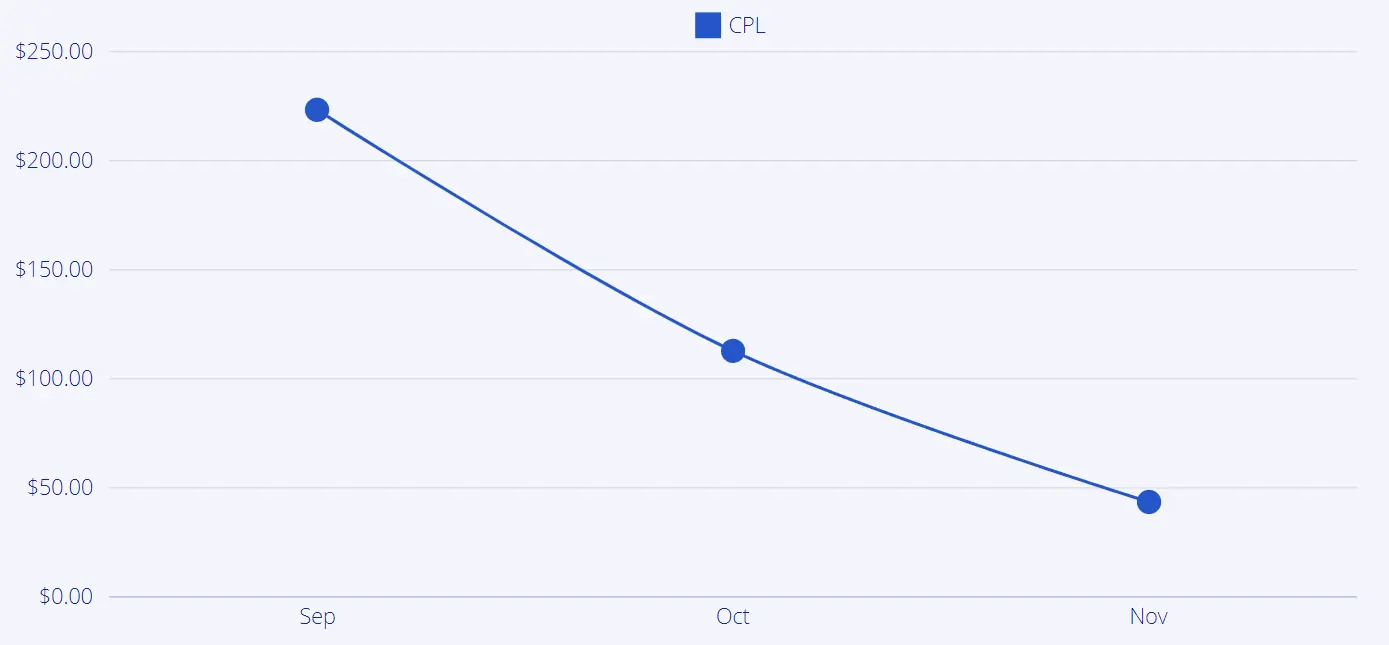
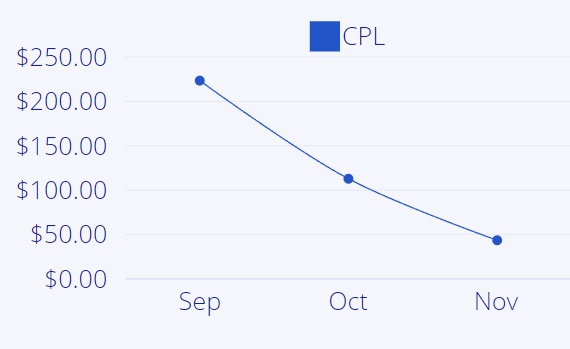
CPA vs Month
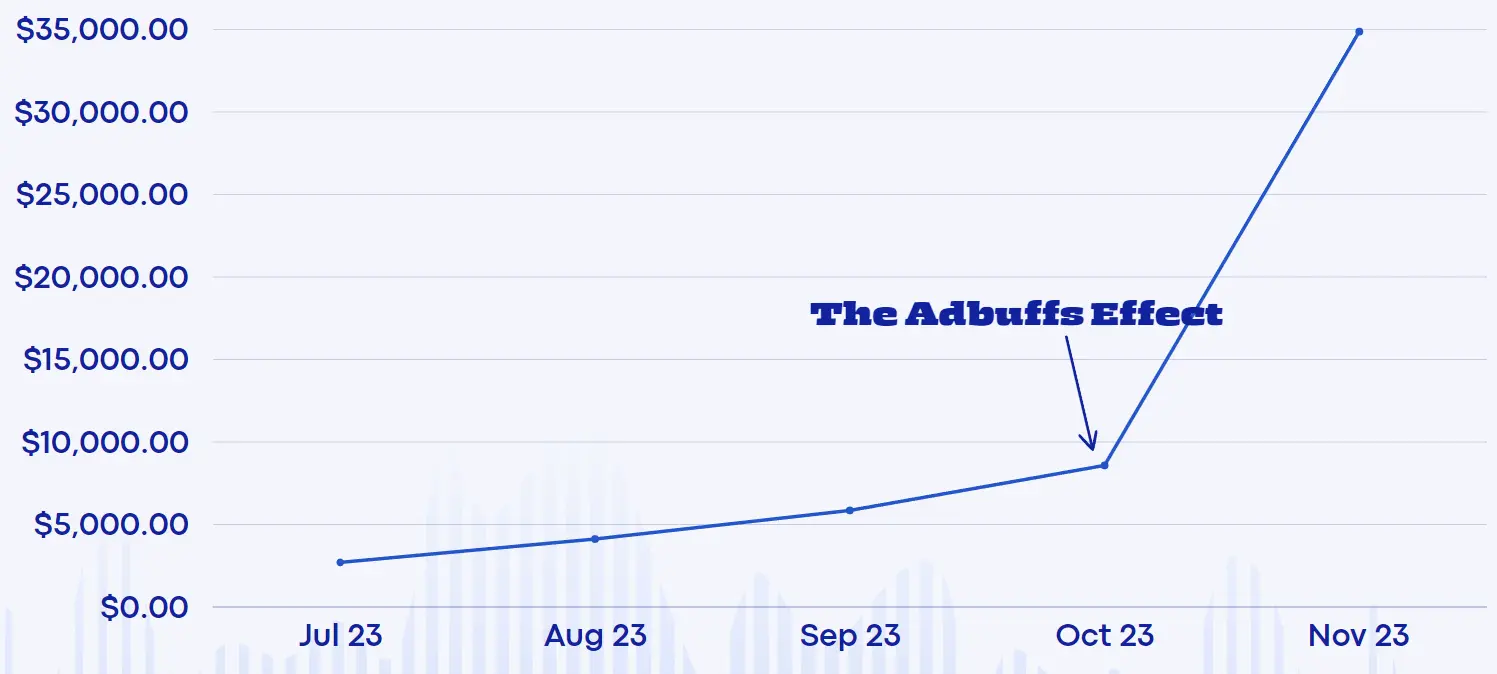
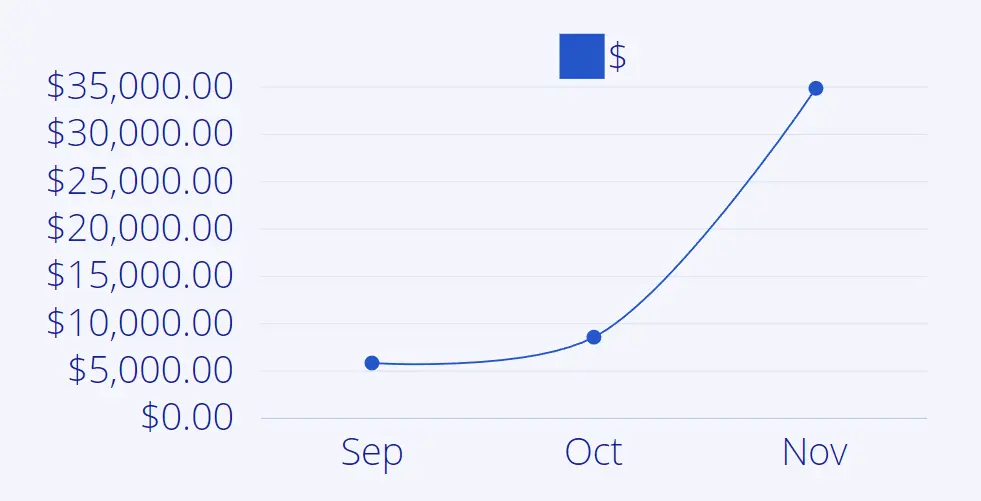
Change In Revenue
July 2023-November 2023
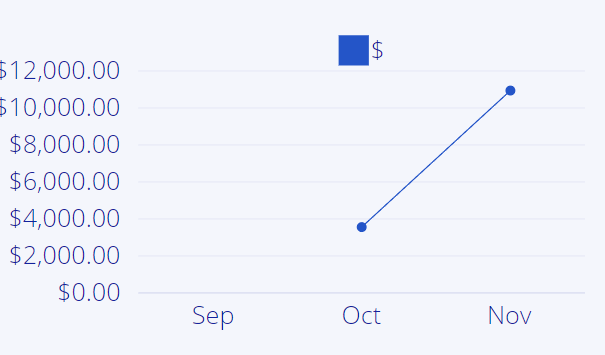
SPENT vs CPA vs ROI- Monthly
Spent
CPA
ROI
Revenue Growth- Monthly
Revenue
FACEBOOK
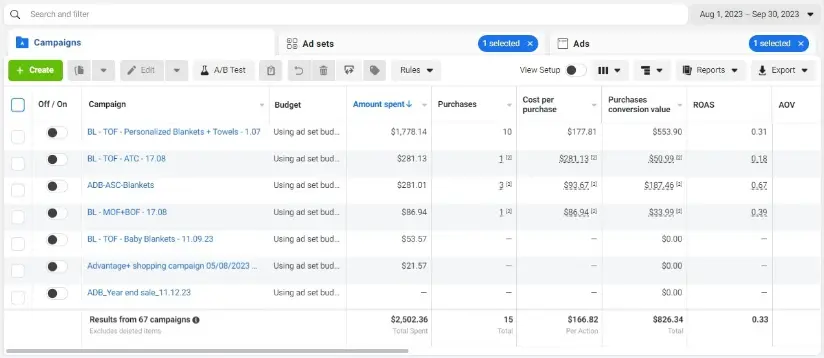
How we did this?
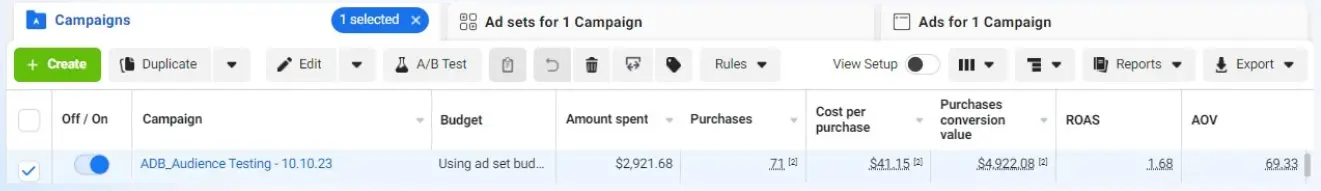
Campaign 1: Audience Testing Campaign
We started a TOF Audience testing campaign, to test new audiences consistently & find out winning ones Till date, it is our most spending campaign for any given period We tested close 30 audiences so far out of which 10 audiences came out as winner & stil running. Testing new audiences(Localike, interests, custom audience etc) are so important so that you can reach out to new prospects consistently.
FACEBOOK
How we did this?
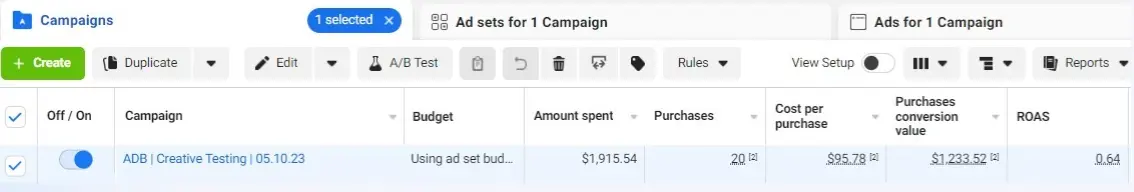
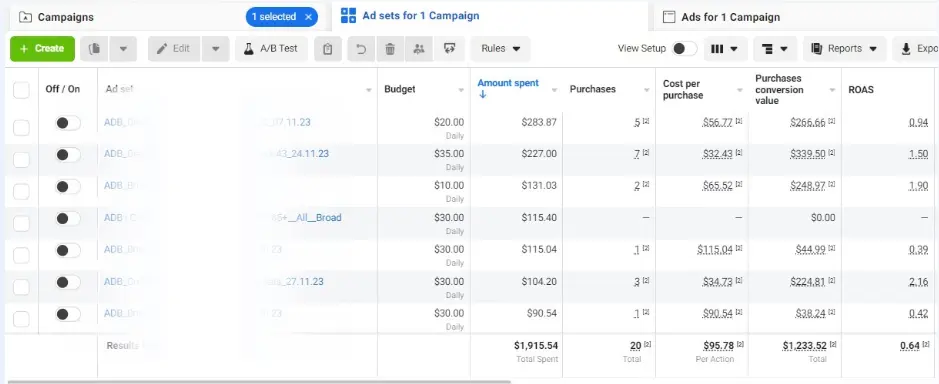
Campaign 2: Creative Testing Campaign
We started testing out creatives in this campaign from the start of October. As it was not one of our man campaigns so we kept spends for the campaign on the lower side.
FACEBOOK
How we did this?
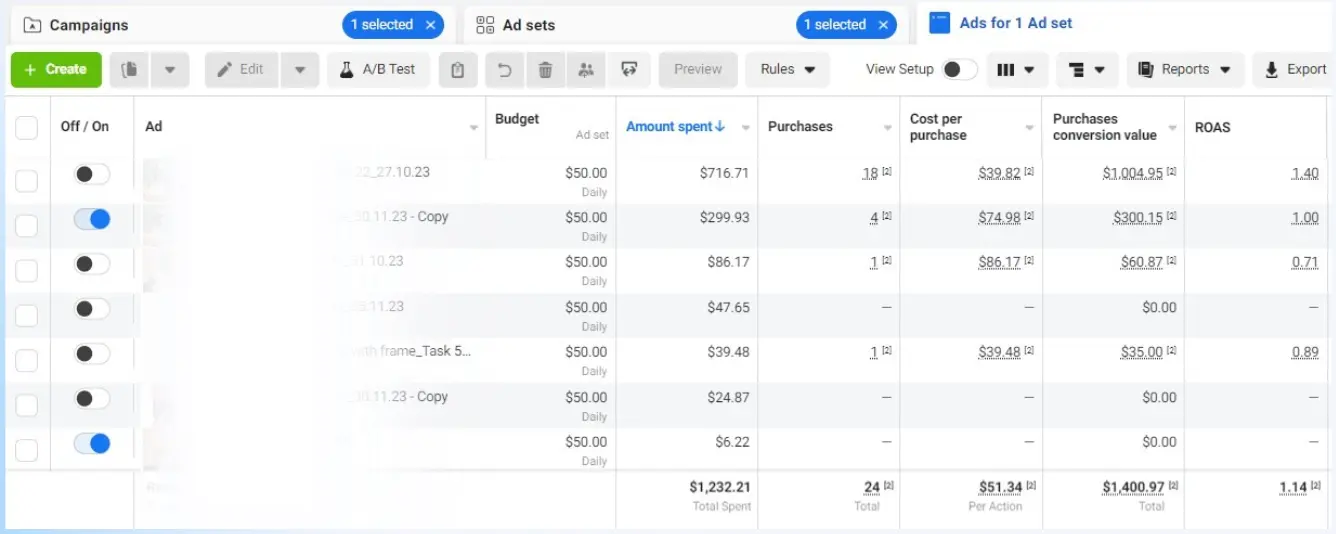
Campaign 3: Evevergreen ASC campaign
We started with the ASC campaign from the beginning of October. We tried out many different creative angles. Then after weeks of testing we found out our winning ad. It was a UGC video mashup Keeping this ad constant we kept on scaling the campaign.
FACEBOOK
How we did this?
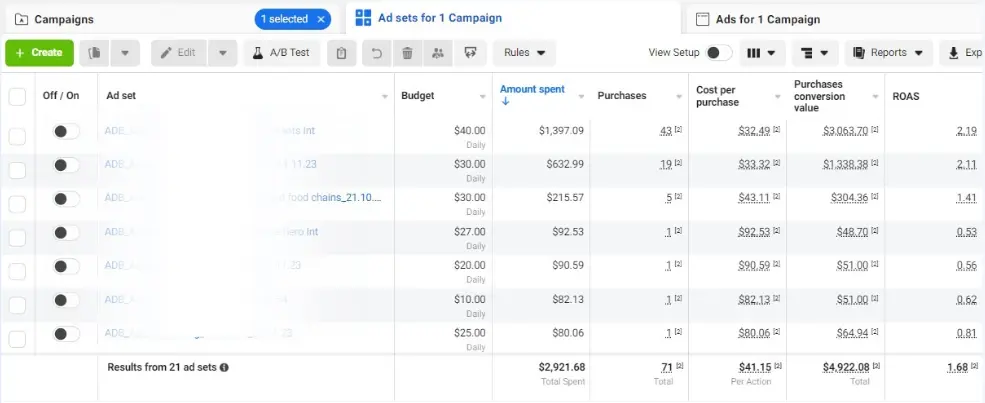
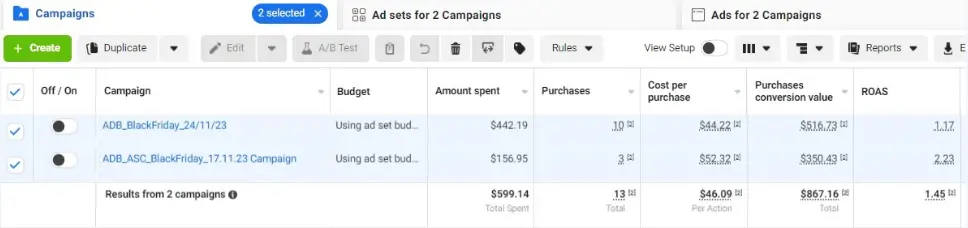
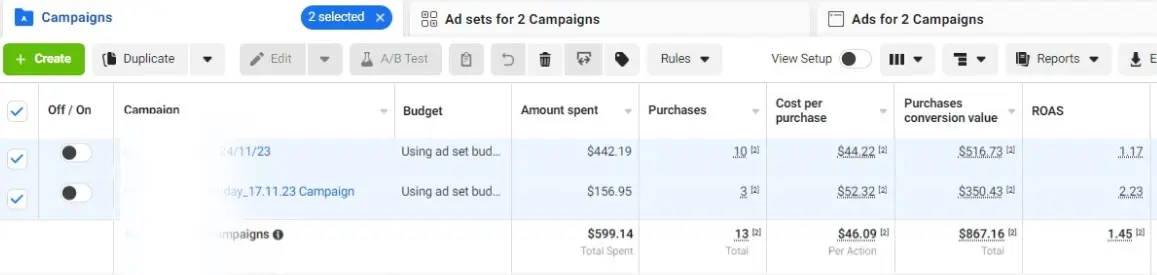
Campaign 4: BFCM campaign
For Black Friday we changed our communications accordingly and run 30% off sitewide. The ads that performed well for us in other campaigns we launched them here with changed communication.
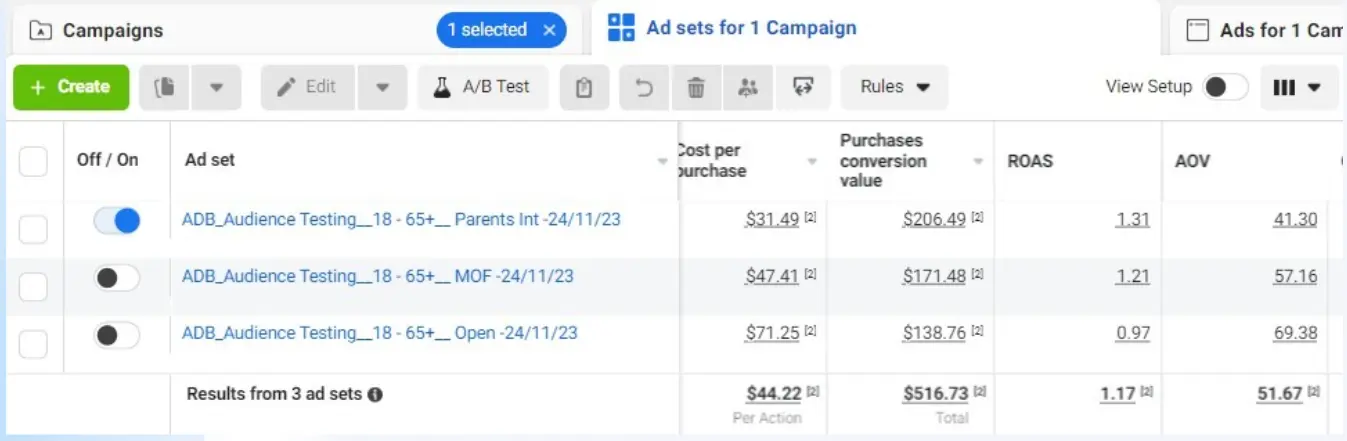
Campaign 4: BFCM campaign
Under the Black Friday campaign we run 3 ad sets-Parents int, MOF and Open. Out of these the Parents interest performed the best.
GOOGLE
How we did this?
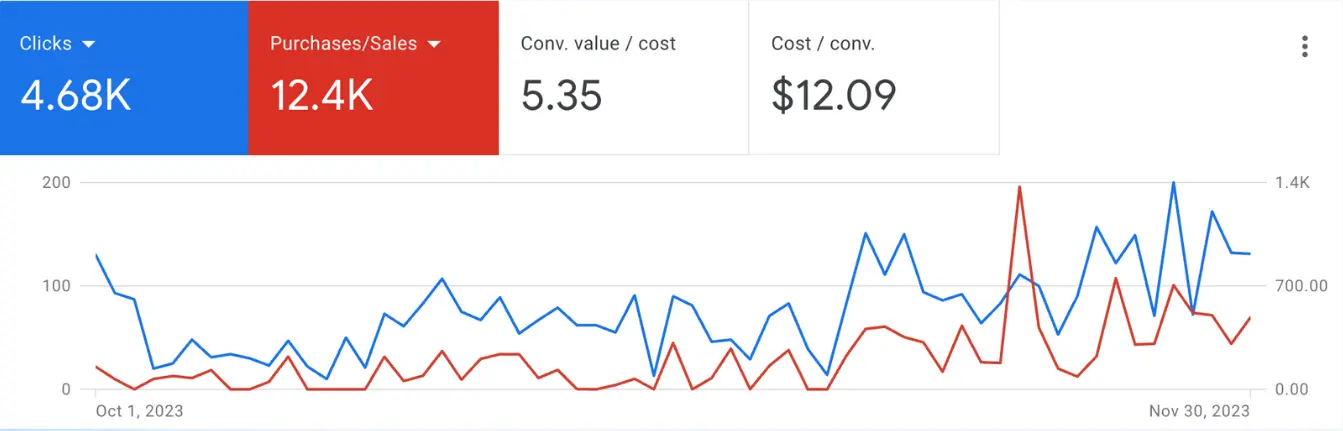
Campaign 1: Performance Max Retargeting
Even with Branded Search on the go, we focused to squeeze in as much conversions as possible from the website visitors by giving them social proof, white highlighting UGCs videos Instead of just expecting to get searches on Google through the branded search, we pushed the limits and made the most out of the website visitors with constant reminders, thus giving us exceptional results.
GOOGLE
How we did this?
Campaign 2: Performance Max For New Customers
With lack of resong on Google Inventory, the immediate action we took was to test the ads on all Google inventory ly negating the requirement to allocate budget and rest individually on all platforma, we mhimssed huge burm Furthermore, with the campaign only tickling for new customers, the business was atile to acquire higher LTV in every conversions.
Campaign 2: Performance Max For New Customers - Segregation & Scaling
As the New Custom campaign worked with several targeted asset groupe in place, some gave us really good conversions while one falled to perform To tum the non-working asset group to cash cow, we paused it, and launched a new campaign with only the underperforming asset group, while tweaking the copy and the onsative a bit mons to suit the audience Takang such a step earlier suly phes the CAC, but with proper signaling to the Google Algorithm this is a unsaid process of keeping the CAC under control The Result Lowest CAG instead of the opposite.
GOOGLE
How we did this?
Campaign 3: Stealing Competitor Customers
With a good amount of data and insights in hand, we had created a full funnel for the brand However, negating the “Awareness” stage does allow a brand to save some money on the overall CAC The price of the products sold by the brand were on the higher side when compared to its direct competitors However, their reviews and customer service were exceptional unlike the others. We used this advantage and aggressively placed the brand amidst its competitors, while excluding the website visitors of our brand from the new
campaign The Result Only the prospects who were considering to buy from our direct customers were shown the ads, where we touched focused our creative efforts higheghting the strength of our brand which were the weakness of the other brands.
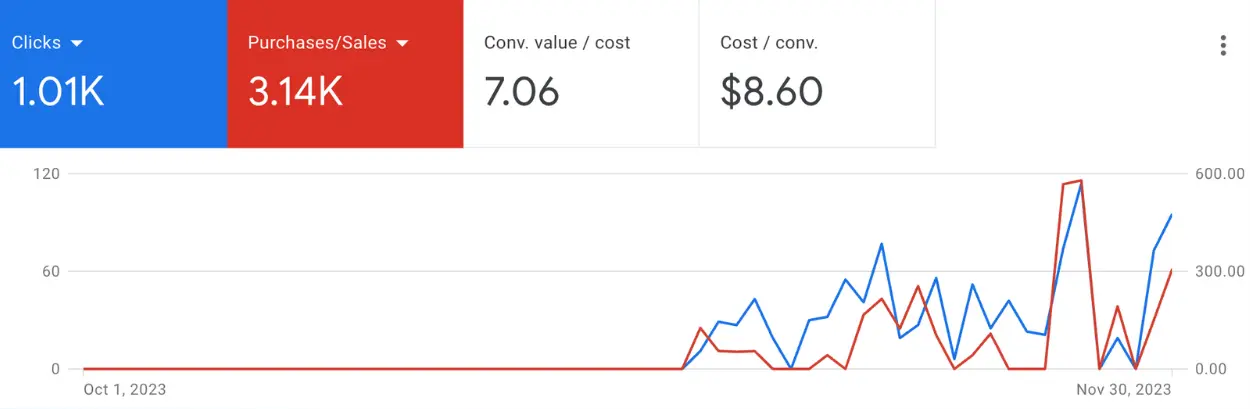
Account Performance- Google Ads
Sept'23 vs Oct'23
Before/After
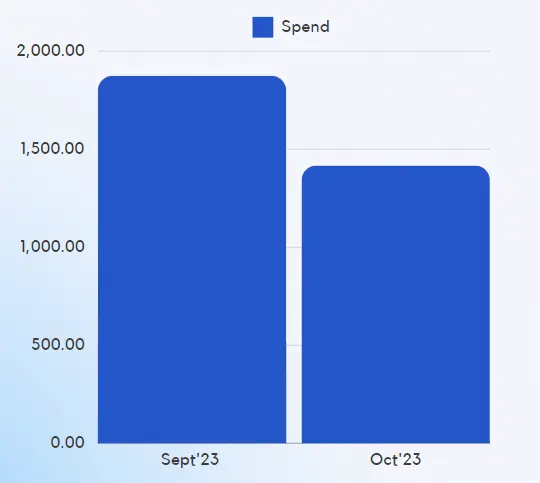
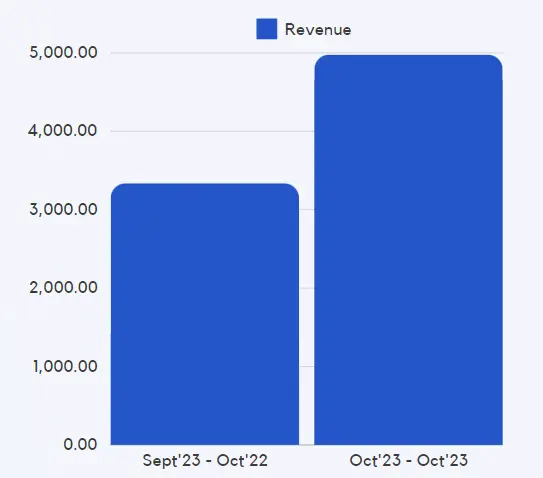
Spend
Revenue
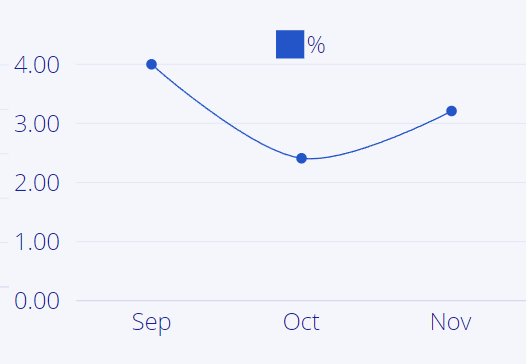
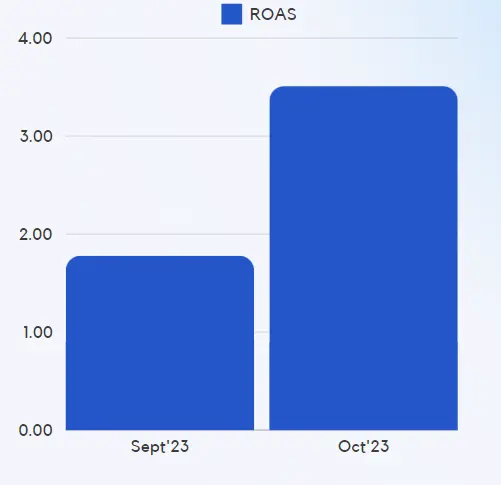
ROAS
The graph highlights a decreases in spending by 24.4% on Oct 23. However, the revenue incresed by 49.15% as compared to Sept 23 with the ROAs improving by 97.19%.
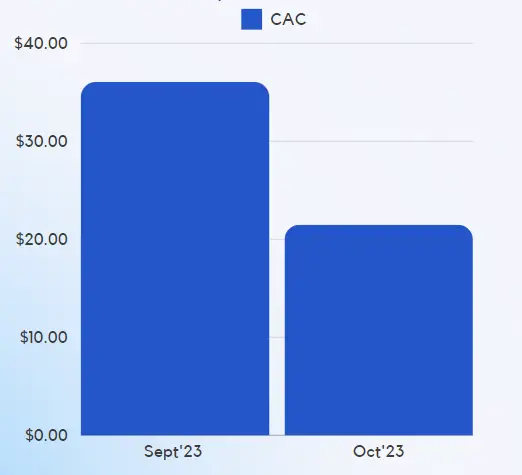
CAC
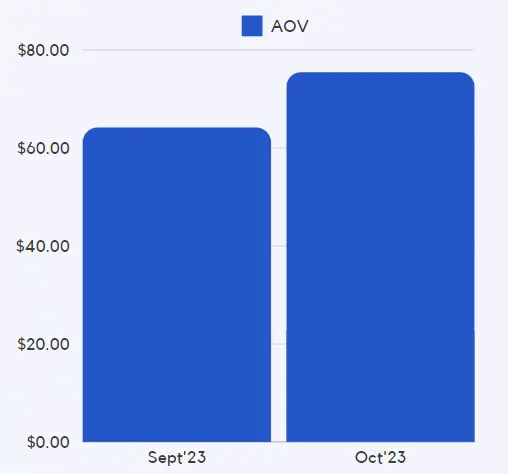
AOV
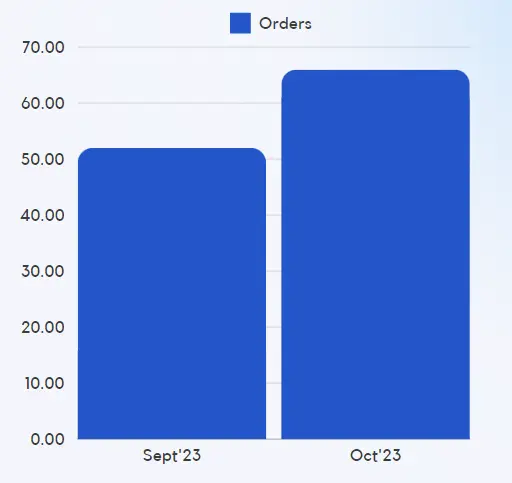
Orders
The graph highlights a decrease in cost of acquisition (CAC) by 40.41% on Oct 23. The average order value (AOV) has increased by 17.609% as compared to Sept 23 with the Purchases Increasing by 26.86%.
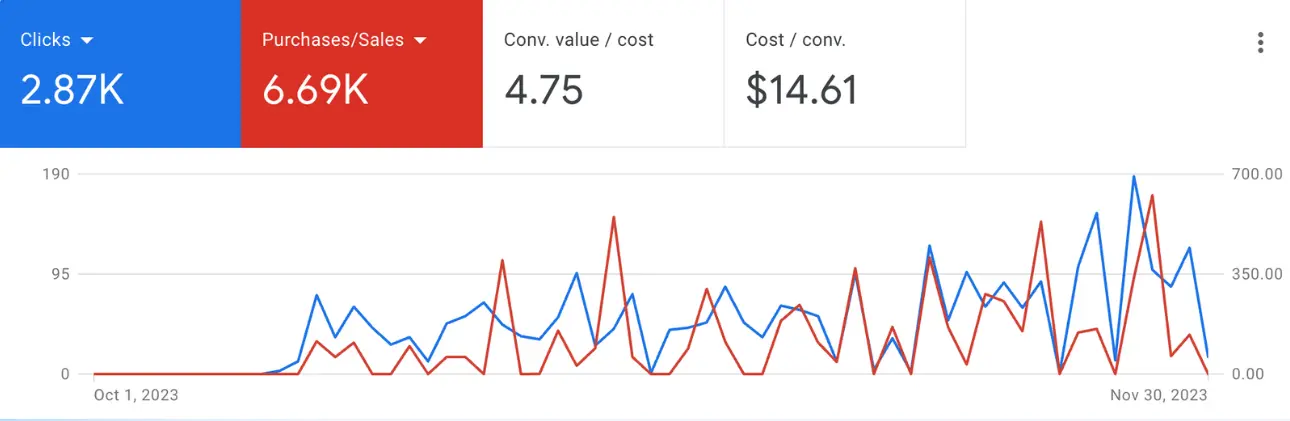
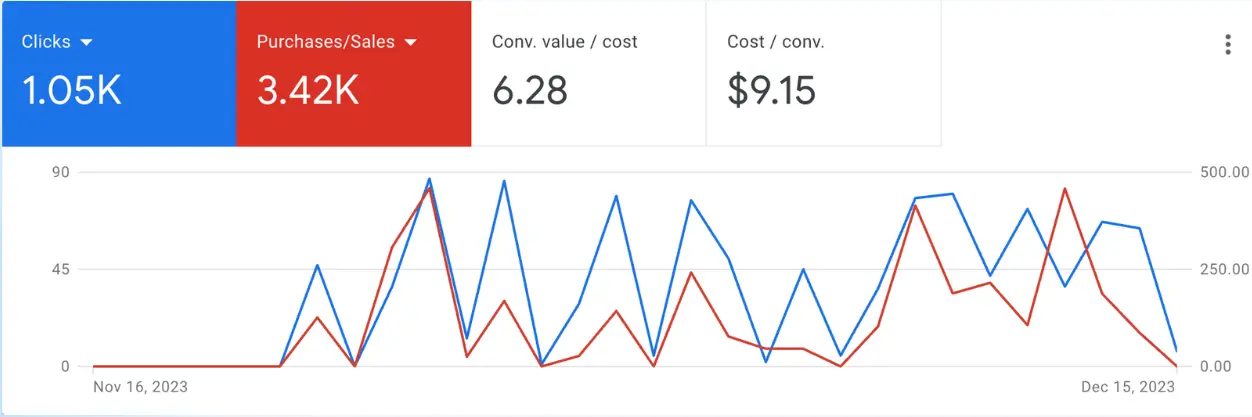
Account Performance- Google Ads
Oct'23 vs Nov'23
Before/After
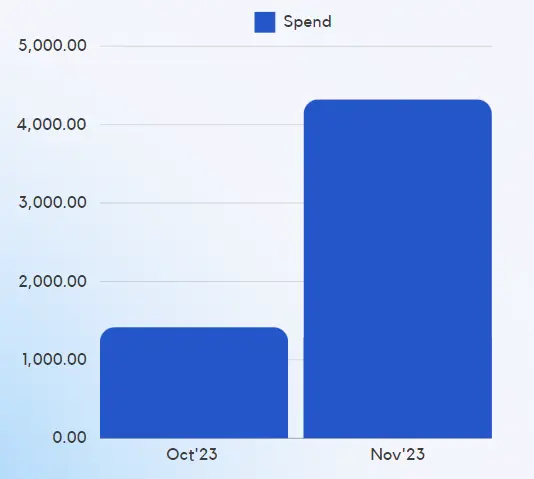
Spend
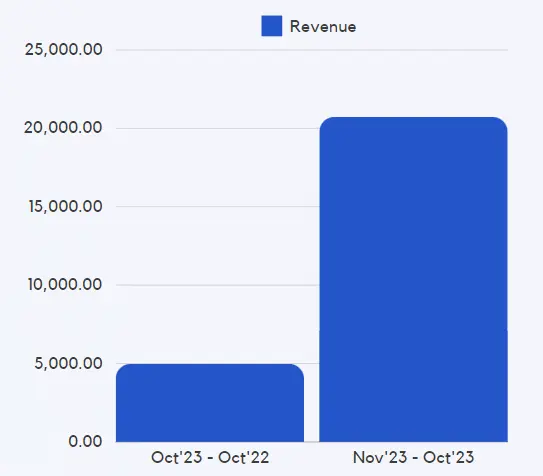
Revenue
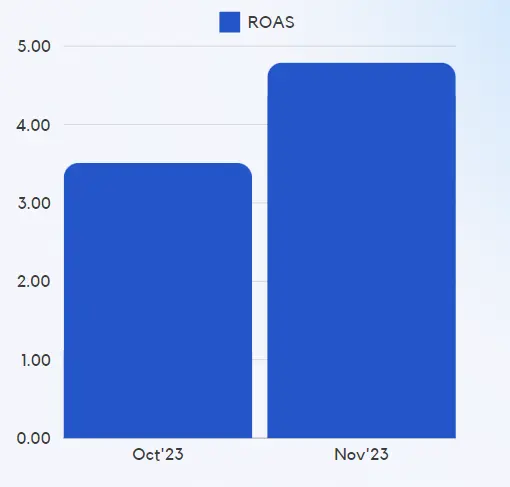
ROAS
The graph shows highlights an increase in spending by 205.049% on Nov 23. As a result, the revenue incresed by 316.223% as compared to Oct 23 with the ROAs improving by 36.46%
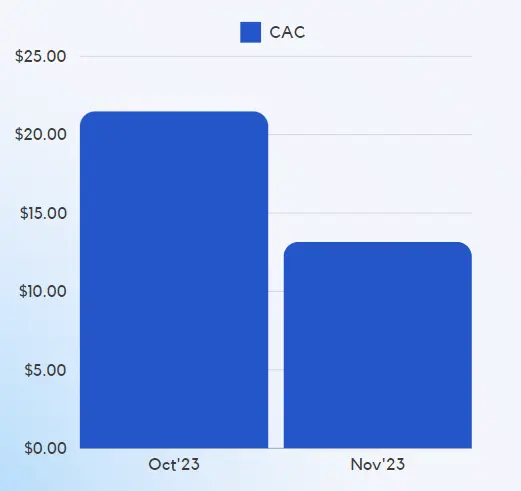
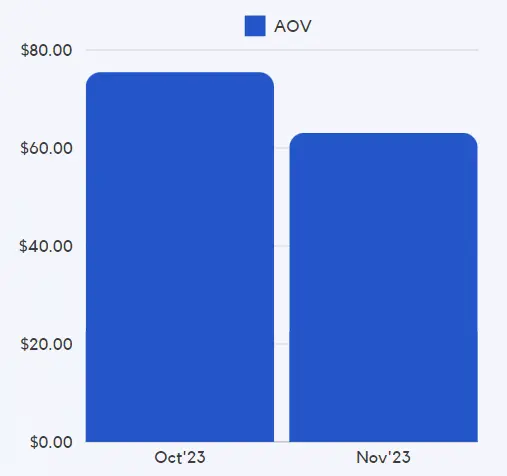
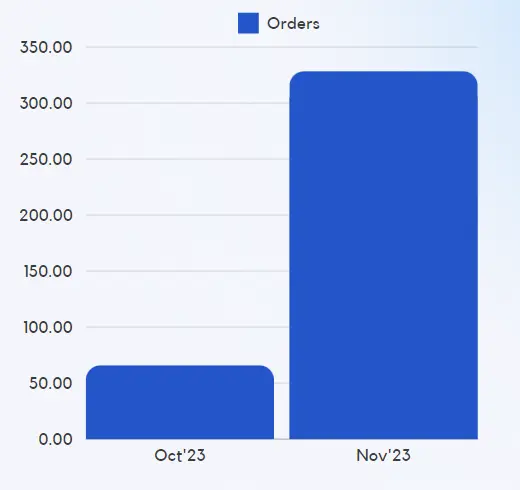
CAC
AOV
Orders
The graph highlights a decrease in cost of acquisition (CAC) by 38.73% on Oct 23. The average order value (AOV) has decreased by 16.41% as compared to Sept 23 with the Purchases Increasing by 397.96%